Sunday, August 20, 2006

8/19/2006

1. China Raise rate, hurt exporter and commodity?
2. Not much news this week, housing is the focus, and I believe it will be ugly. Basically I think this week will be ugly for stocks again. 1-2% retreat is possible.

Moday: LOW
Tue: TOL, BGP, MDT, INTU
Wed: BHP, CHS, MIK, SFD
Thu: BONT, FRED, WSM
Fri:SNP, RY

Thursday, August 17, 2006

08/17/2006

OE day:

candidate : goog(380 or 390) ebay(27.5) ISE AAPL(67.5) PD(90)
brcm( will xie in sympathy with MRVL)

I expect market pullback some, reasons are:
1. weekend , ppl take profit
2. OE day, MM may need some balance for shorted calls
3. up so much, about 90p for NQ
4. MRVL, DELL all down AH, ==> semi weak

Thursday ER moves:
UP: BRCD, SCSC, BEBE, LAVA
DOWN : DELL, MRVL

Tuesday, August 01, 2006

Monday, July 31, 2006

future day trading rules

看长线心得

The most important factor for middle-long term is liquidity.

So we should look at following criteria:
1. cash reserve
2. interest rate
3. inflation rate
4. economy growth

which means when there's tons of cash (held by government, companies, individuals etc), interest rate not going up, inflation tame, economy not recession, market will go up until some or more of the criteria break.

The rally from August just verified above criteria when Fed stopped hiking, and CPI, PPI below expectation.

future day trading rules

  1. Gap(intraday) up/down rule: after the first relative big gap (for example, >2p for ER2), there will be a small window (usually less than 10 minutes) for trapped position to cut or for new position to setup, because most time there will be another gap after the small window. Gap means MM's action. Retailers cannot cause gap unless force cut loss.
  2. trend line theory: when trend line break, will have big move. Either break up or down.
  3. extreme theory: market always go to extreme, and trend days usually close at highest or lowest.
  4. failed bounce/pullback theory: a failed bounce will break previous low. A failed pull back will make new high.
  5. round trip: market tend to do round trip. ER2 range usually>30p
  6. 11:00am spike: 11:00am(PST) program trading started to be active, usually there’s spike up/down around 11:00.
  7. AH extreme: AH futures tend to go extreme due to small volumn.
  8. box range: futures most time move within a box. When the upper bound or lower bound break, it move to next box.
  9. neckline theory: for head & shoulder pattern, when neckline break, will have big move.
  10. retest extreme theory: a generalization of rule #2.
  11. No average down or average up.
  12. No short before see red bar, no long before see green bar.
  13. No long on resistence. no short on support.
  14. Early cut rule: when you first time feel panic, it's time to close position. Dont wait to cut until you feel numb.
  15. Early reversal theory: if up/down a lot in the first hour, there's big chance to reverse later. This is the exception to rule #1.
  16. For big news(such as FED, GDP etc), focus on market reaction instead of own interpretion. When market goes to opposite to your analysis, give up your interpretion and follow market.
Check List Before a Trade
  1. Big news out? What's the response? How about volumn?
  2. Oil
  3. TNX
  4. What's the trend? --> draw up or down channel.
  5. What's the resistence?
  6. What's the support?
  7. What's the target?
  8. What's the stop?
Money Managerment are discussed here (Link) .

Thumb of rule based on Kelly criterion:

f
* = fraction of current bankroll to wager;
b = odds received on the wager;
p = probability of winning;
q = probability of losing = 1 − p.

As an example, if a gamble has a 40% chance of winning (p = 0.40), but the gambler receives 2:1 odds on a winning bet (b = 2), the gambler should bet 10% of his bankroll at each opportunity, in order to maximize the long-run growth rate of the bankroll.

For even-money bets (i.e. when b = 1), the formula can be simplified to:

f^* = 2p - 1 . \,\!

Pivot, Resistence & Support

Link to calculate: http://www.fxstreet.com/forex-tools/pivot-point-calculator/
Post regarding it

H = previous day's high
L = previous day's low
C = previous day's close

Pivot Point = (H + L + C)/3
Resistance = 2*PP - L
Support = 2*PP - H
Previous day's last two hour high = L2HrHigh
Previous day's last two hour low = L2HrLow

A link about bottom stocks:

http://www2.barchart.com/sectors.asp?sec=bottom~100~stocks.sec&sort=99

Thursday, April 27, 2006

Tuesday, April 04, 2006

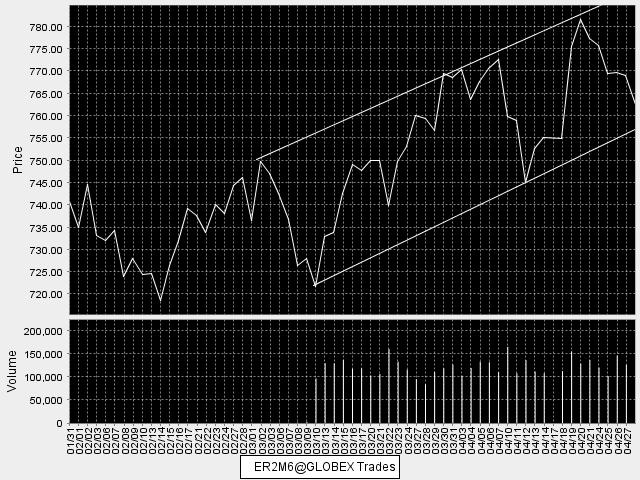
ER2 chart for April 04, 2006


The trend line is very clear today.

Friday, March 24, 2006

Stock Performance from 12/31/05 to 3/24/06

RUT from 732 to 753.83, + 12%

SP500 from 1248 to 1303, + 4.4%

NAS from 2205 to 2312, + 4.9%

NDX from 1645 to 1680, + 2.12%

Thursday, March 02, 2006

Some other rules

1. Don't trade the first 30 min or ER2, no trend at all

2. 11AM some trade opportunity

3. 12:45 some trade opportunity

4. 15min before close, it's volatile, set very high order and it can be filled some times.

5. always follow trend!

03/02

Market was still strong today, it get back most loss in the morning.

IWM put/call ratio almost 20:1. Are people nervous or just over-bearish?

Bears failed to gain traction once again, even as oil and long-term rates rose. I expect stocks to make another push higher soon on another round of short-covering.

Cut lose, and let winners run!

1. when you have a lose trade, or you feel something wrong, get out! Admit you're wrong, and you have lot of other opportunities to get your loss back.

2. Somebody recommends that cut your lose when it > $100

3. cut lose and stay in the game!

Trading by pattern

1. Rules
A. head : when a head formed and stock starts to go down ===> short

B. bottom : when a bottom formed and stock starts to go up ===> long

C. box
C1: in at bottom, stop 0.1 below bottom, sell around high ceiling
C2: short at ceiling, cover around bottom
C2: when box broken, follow the trend

D. trend broken: follow (remember to draw trend line)

Tuesday, July 19, 2005

Usefull Links & Resources

Unsual movement of stocks:
http://nasino.blogspot.com/

Copied from
http://www.siliconinvestor.com/subject.aspx?subjectid=37195

Started By: Chip McVickar -- (Moderated) -- Started: 4/19/2001 8:09:56 AM

This forum is to congregate our efforts at understanding the Bond, Currency, and Commodities Markets...(as well as Index Futures). I wish to learn more about these markets and in the process maybe others will help develop the thread as a resource. So lets concentrate our talents and resources here to benefit each other and post our positions, thoughts, research and market reads.

Useful Links
Bonds:
http://www.bondweek.com/bw/index.html
Centers:
http://www.cme.com/
http://www.cbot.com/
http://www.nymex.com/
http://www.mgex.com/
http://www.federalreserve.gov/
http://quotes.ino.com/
http://www.futures.net/
http://commoditytrader.net/
http://commoditycentral.com/commoditycentral/
http://www.crbindex.com/
http://aolsvc.news.aol.com/pf/businessnews/usmarket/a/USStockMarkets
Charts:
http://www2.barchart.com/mktcom.asp
http://www.barchart.com/
http://futures.tradingcharts.com/chart/
http://www.futuresource.com/
http://www.britefutures.com/home.asp
http://stockcharts.com/charts/
http://www.quote.com/
http://www.tradesignals.com/
http://www.jackcarl.com/charts.html
Commentary:
http://markets.tradingtech.com/html/curindex.asp
http://www.futuresguide.com/que/today.asp
Commentary Links:
http://guniff.cairns.net.au/~sharefin/Markets/Gold20.htm
http://www.contraryinvestor.com/index.html
Globex Prices - Overnight Markets:
http://www.cme.com/cgi-bin/gflash.cgi
http://www.siliconinvestor.com/readmsg.aspx?msgid=13826528
http://www.bloomberg.com/markets/wei.html?sidenav=front
Economic Calendar:
http://www.briefing.com/schwab2/markcal.htm
News:
http://www.oanda.com/site/currency_news.shtml
http://www.forexnews.com/
http://www.afr.com.au/
http://dailyfutures.com/
http://futuresmag.com/news/news.html
http://markets.ft.com/ft/gx.cgi/ftc?pagename=View&c=Collection&cid=IXLCZNBEUCC&mktsreg=r...
Realtime Streaming Quotes-Free:
http://www.astrikos.com/public/quotes.html
http://www.quotetracker.com/
Research:
http://www.forextrading.com/
http://www.orc.ca/~blees/visitors/trader.htm
http://www.cftc.gov/dea/cot.html
http://www.moneynet.com/content/MONEYNET/Currency/Currency.asp
http://www.ipe.uk.com/about.html
http://www.webtrading.com/index.html
http://www.fyii.net/news/news.htm
http://www.tulipsandbears.com/tulipsintra/commodities.htm
http://www.e-analytics.com/fudir.htm
http://home.att.net/~HahnsCorner/index.html
http://www.mrci.com/qpnight.htm
http://www.tradingtactics.com/exchange_data.htm
http://www.nfa.futures.org/
http://w3.aces.uiuc.edu/ACE/ofor/
http://quote.yahoo.com/
http://www.e-analytics.com/bonds/bonddir.htm
Resource Links:
http://www.nt.net/media4/biz.html
Commitments of Traders Reports - USGov:
http://www.cftc.gov/dea/cot.html
http://www.commitmentsoftraders.com/cotp3.htm
Commodity Symbols (quote.com):
http://www.quote.com/quotecom/misc/symbol_search.asp?option=f
Currencies:
http://www.bloomberg.com/markets/currency.html
Currency Converter - FXConverter - 164:
http://www.oanda.com/converter/classic
Forex:
http://www.fxstreet.com/
http://www.forexnews.com/
Quotes:
http://www.quote.com/quotecom
http://www.mrci.com/ohlc/
http://quotes.ino.com/
Weather - Crop Reports:
http://www.agweb.com/
http://www.profarmer.com/
http://www.drought.noaa.gov/
http://enso.unl.edu/monitor/monitor.html
Trading for Beginners-Commodity Futures :
http://www.rb-trading.com/begin.html
Magazines:
http://www.magnetsearch.com/cgi-pub/template.pl?category=money/MI$C&template=futuresindex.html
http://www.traders.com/
http://futuresmag.com/

Attention
Please be aware and take the time to read the numerous disclaimers that are found in conjunction with trading the Bond, Currency, Commodity and Index Futures Markets. We the participants are here to Learn and Share our Interests, Opinions and Knowledge. We are not advocating the buying and selling or taking of any positions in any market.

Friday, May 20, 2005

5/20 Trading 总结及经验

今天故事range小, 大多个股range也小,只好刮皮.

今天主要刮了QQQQ和GOOG的皮.
先bot QQQQ May 37 call at 0.5, sold at 0.55
bot QQQQ May 38 put at 0.5, cut at 0.45
bot QQQQ May 37 call at 0.55 again, sold at 0.65

然后开始刮GOOG的皮:
bot GOOG May 240 call at 1.2 sold at 1.3
bot GOOG May 250 put at 8.9 sold at 9.2

carry over position:
GOOG June 240 call at 8.2

Prediction: GOOG next monday will gap up $3

教训:
1. 不该focus在QQQQ上. OE day most time small range, hard to scalp. 费死力气了在QQQQ上刮的皮也没多少.
2. 很迟才体会到GOOG的强势. 其实在GOOG 12:30pm 突破range
的时候就该舍弃QQQQ trading.

另外, IB web trader sucks, slow. so I cannot trade future. It's better to trade NQ future instead of QQQQ option.

Monday, May 16, 2005

5/16 Trading

Plan for 5/17:
if PPI low and open high, put index on high if PPI high and open low, call index on low other case watch. Stocks to watch: GOOG (put mode), home builders, PHM TOL

Traded GOOG MAY 130 calls again today.

look at intra-day chart, it shows break out sign when stock approaching 229.5. In calls at 2.3.

The green spot is when I bot calls. This is the most reliable break out pattern.


and half hour before close when stock rallied to 231.3, it shows sign of exausting. So out at 3.1. At this time, stock price cross the 5-min MA again, but going downward.

The stock dropped to 231 at close. and option price drop fast as it expires this Friday.

Friday, May 13, 2005

5/13 Trading

Sold GOOG options carried over from yestoday at 3. Missed the top 3.4. Anyway, profit is good.

Missed chances to trade QQQQ MAY 35 calls and MAY 37 PUTS. The trend is very clear. Missed some very big profit here.

Next week, I expect market up.

the only reason market is down is that people uncertain about the economy. I don't think the economy is weak yet. Just like beginning of last year people also worried about economy "soft patch". And if economy shows strong sign again, oil and materials will get strong. So I expect the oil to up with market which is a different scienario in the first half of 2005.

EUR break down again. It dropped to 1.26 level. This is a major trend reverse. I expect it down to 1.23 level to get meaningful rebounce.

Thursday, May 12, 2005

5/12 Trading & Lessons

Another option day trading day with lessons.

Sold GOOG MAY 130 calls at 4.4 at loss. This is ok as cut loss fast is way to survive.
Got back at 3.8 and didn't sell at 4.4 when it's rebounding. Lesson 1!!!! Too greedy!!!! Ignoring turn around signal and let greedy in control.
Sold at 3.5 at loss and didn't buy puts as planned yestoday. Lesson 2!!!! Not executing plan!!! This is the time to get in puts according to intra-day chart even put is not at the best price of the day.
Bought back at 2.65 as GOOG approaching support area at 228.3, and didn't sell at 3. Lesson 3!!!! Neglecting reverse signal and let emotion in control!
Didn't buy put at 3 even order is ready. The put worth 4 now. Lesson 4!!!! Changed plan at will. and don't have follow on plan.
The last position now is break-even, but very possible to turn to loss tomorrow. Lesson 5!!!! Carry option position overnight to Friday! General rule should be closing option positions before Friday.
Forgot to put LNG. It's my put candidate of last night's research. Lesson 6!!!! Write down all research result. Or it get forgotten.

Lesson 7!!!! From GOOG intra-day chart, the up momentum is fading away, should switch to do PUT options instead of CALL options. The trading plan is not well planned.

Today I broke several rules and get punished. The penalty is not big yet. But, a 10k profit day turns to a 2k loss day. And there are several lessons learned. To not make same mistakes again is crucial to future success.

General Market:

EUR gap down for the second consective day. This is still a myth to me. From the trend of EUR this year, looks to me the depreciating US$ vs EUR has reversed. Expect more down of EUR ahead. I expect EUR down to 1.23 area in 3 month.

Oil big down for the second day, and comodities like metal, coal all down, implying a slowing economy, and coincedence with today's WMT warning.

But according to my personal experience, the job market now is very good and better than last year. So what does this mean? Strong job market will spur spending and thus inflation ==> FED raise rate? and coming with slowing economy at the same time? I'm lost here. and something is wrong.


Wednesday, May 11, 2005

5/11 Trading

GOOG in break out mode.

Day traded GOOG MAY 230 calls today. Bought at 2.8 yestoday and sold at 3.8 today,
Bought back at 3.3, and sold at 4.8
and bought back at 4.7 again,

Plan to sell tomorrow before conference meeting. Expect the price > 5.5. and buy MAY 130 put after sell calls.

Wednesday, April 06, 2005

4/6 Trading

ADBE is very strong today. So I bot May 70 calls when the stock is 67.4

But it's a wrong choice, I should buy back April 65 calls. The profit is much more.

But to buy back stuff I just sold yesterday I have 心理障碍. :(

Greenspan's speak knock down home builders but not too much.

Review on SHLD:

It's good chance to put SHLD when it got reversed in the morning. It's an exhausted run.

Tuesday, April 05, 2005

4/5 Trading

Bot ADBE April 65 calls at 65.7 level yesterday. 65 is kind of support and last break out start point.

Sold today when stock is at 66.9 for quick profit.

This is trader's market. Hold is dying.

Market form a bottom here for short term. Expect a rally to 2060 level.

Missed BSTE. Should chase it at opening. It has big short interest. and 50 is strong support. So even down no much space. And it's highly chasable when it starts to run.

We should find these kind of pre-run stocks. Once it starts to run, chase it.